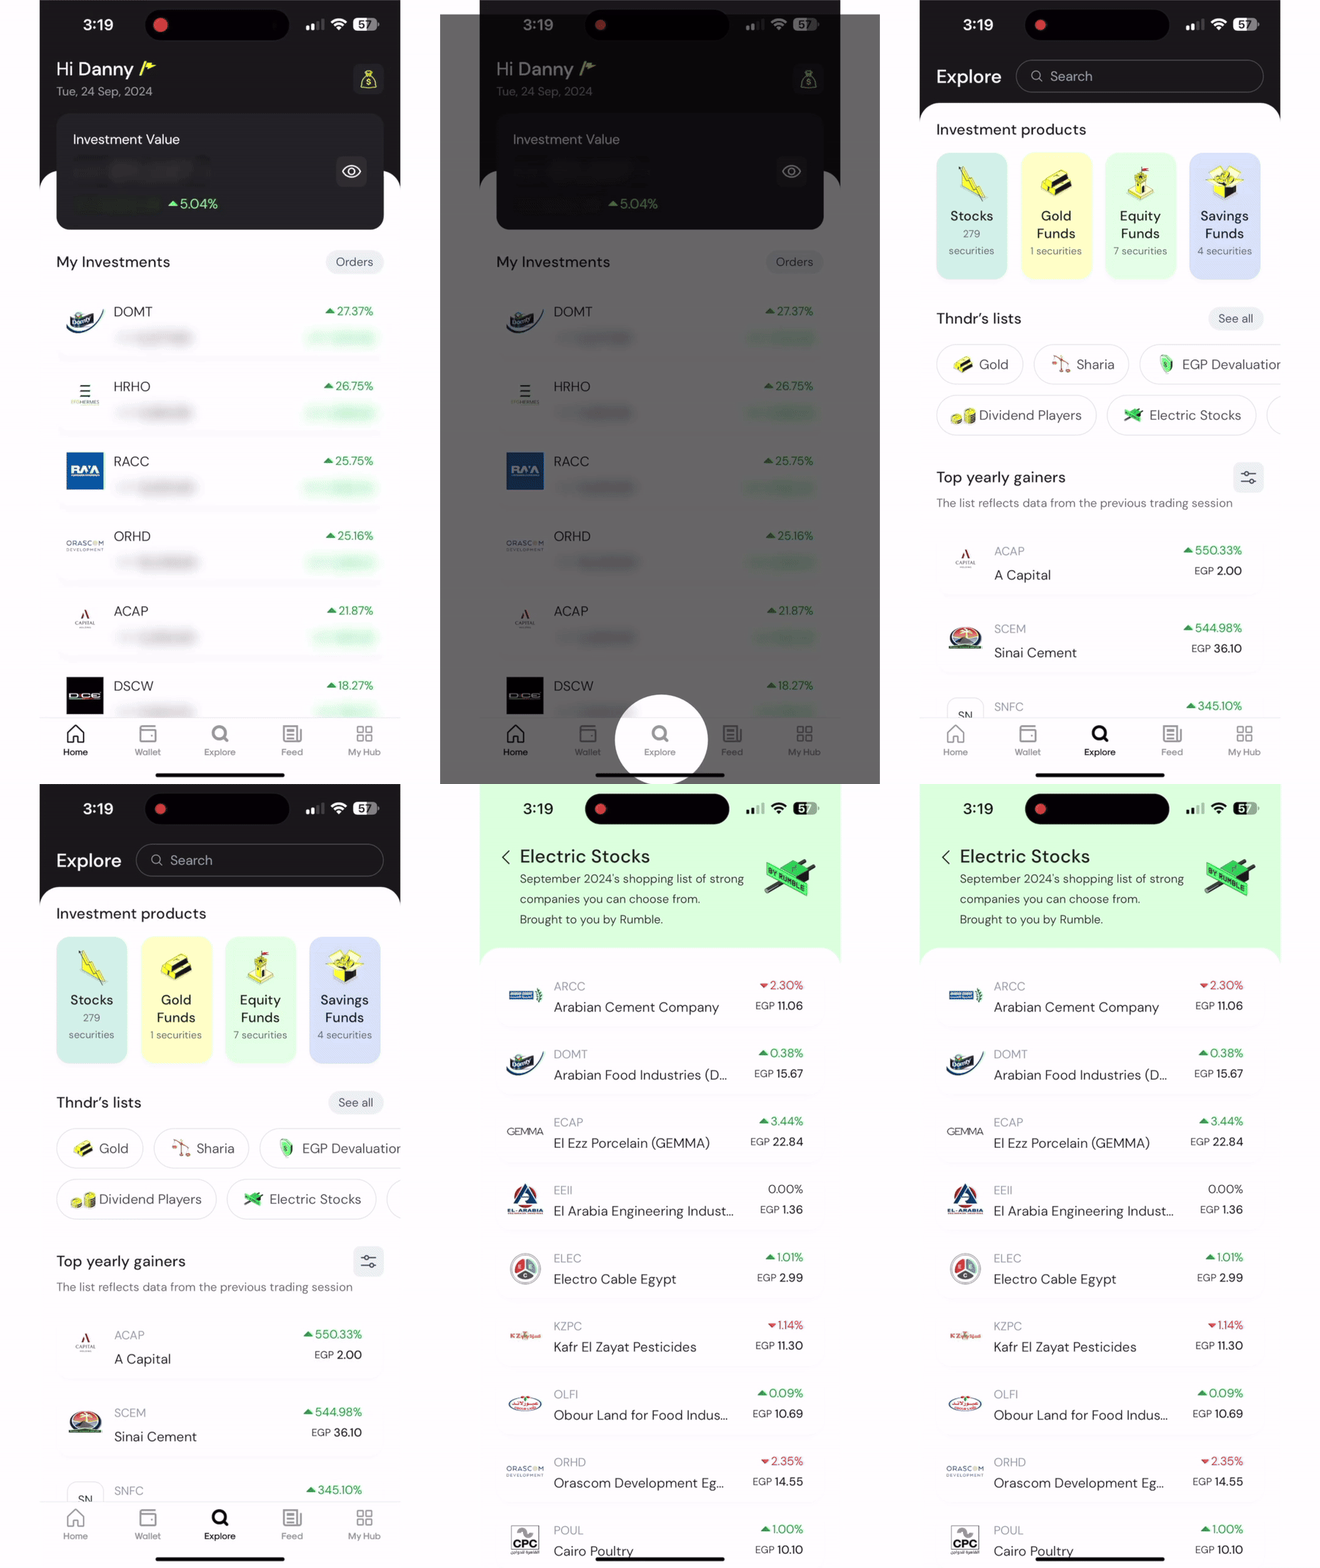
Are you a long-term investor looking to build a solid portfolio of fundamentally strong companies? If so, you’re in the right place! We’re excited to introduce the new and improved version of Electric Stocks, crafted in partnership with Rumble—your financial advisor*
*Rumble—your financial advisor, is an investment advisory platform created by the same team behind Thndr. For more about Rumble please click here
Why Electric Stocks?
Electric Stocks are companies that have consistently delivered financial results above the market average. The previous version of Electric Stocks had already been outperforming the market, and with this new iteration, we’re taking it up a notch. This list has been carefully selected based on a methodology that ensures that you have fundamentally strong and well priced companies to choose from when building your portfolio.
What Makes a Fundamentally Strong Company?
A fundamentally strong company typically has:
- A solid business model
- Above-average growth
- The ability to generate profits from invested capital
These characteristics contribute to long-term growth in value and, in turn, returns for investors. To find these companies, we dive deep into their financial statements from the past eight quarters, analyzing specific ratios that reflect their financial health.
We categorize our analysis into five key areas:
- Growth
- Financial Performance Stability
- Profitability & Efficiency
- Risk
- Earnings Quality
But that’s not all. We’ve added a sixth category to our analysis: Valuation. This ensures that the stocks on this list are not only fundamentally strong but also valued at a good price, using the PE ratio as our primary metric.
What is a PE Ratio?
The PE ratio, or Price-to-Earnings ratio, is one of the most common metrics for valuation. It tells you how much investors are willing to pay for a company’s earnings. We specifically look for stocks with a PE ratio of 7x or less, which we consider “cheap” in the context of the Egyptian market.
For comparison, the average PE for EGX30 over the past five years has been 9.2x. This means that Electric Stocks are not just fundamentally strong—they’re also valued at a relatively “cheap” price.
P.S. This valuation approach is a high-level exercise to identify potentially undervalued companies. If you’re looking for a more in-depth analysis, subscribing to Rumble will give you access to more in-depth analysis and expert recommendations.
Where can I find the Electric Stocks list?
You can find the latest list of Electric stocks on Thndr under the Explore section

How to Use the Electric Stocks List
Think of the Electric Stocks list as your monthly company shopping list that will be updated and sent out at the start of every month.
Here’s how you can make the most of it:
- Choose 5 to 10 stocks that best fit your investment strategy.
- Sell when a stock is no longer on the list:
- If it’s off the list, it could mean that the stock’s multiples are higher, indicating a higher price. This might be a good time to sell and lock in your gains.
- Alternatively, if you believe in the company’s long-term potential, you might decide to keep investing.
- Fundamental changes: If a stock is removed due to changes in fundamentals, it’s time to sell.
We’ll keep you updated on what’s in, what’s out, and why, along with the performance of the list each month.
Electric Stocks scoring methodology
The nitty gritty details
For those of you who want to dive deeper, here’s how we select the Electric Stocks:
Category 1: Growth
- 8-Quarter Revenue Compounded Quarterly Growth Rate (CQGR)
- Calculation: We calculate the compounded growth rate (CGR) over the past eight quarters. For example, the latest financials are for Q2 2023, so we take the CGR from Q3 2021 to Q2 2023.
- Rationale: We wanted to measure the growth of companies’ top lines.
- 8-Quarter Operating Profit Compounded Quarterly Growth Rate (CQGR)
- Calculation: We calculate the compounded growth rate (CGR) over the past eight quarters. For example, the latest financials are for Q2 2023, so we take the CGR from Q3 2021 to Q2 2023.
- Rationale: We wanted to measure the growth of companies’ operational performance.
Category 2: Financial Performance Stability
- 8-Quarter Revenue Coefficient of Variation (standard deviation/average)
- Calculation: We divide the standard deviation of the past 8 quarters (i.e. Q3 2021 to Q2 2023) by their average.
- Rationale: We wanted to make sure revenues aren’t volatile, such as those that depend on contracts or are cyclical by nature.
- Operating Profit Margin Coefficient of Variation (standard deviation/average)
- Calculation: We divide the standard deviation of the past eight quarters (i.e. Q3 2021 to Q2 2023) by their average.
- Rationale: We wanted to make sure companies with non-recurring items skewing operating profits are not given a misrepresentative high score.
Category 3: Profitability & Efficiency
- Asset Turnover Ratio
- Calculation: We take trailing 12-month sales then divide it by average assets (average of latest quarter and corresponding quarter the year before).
- Rationale: We wanted to measure how well companies utilize their assets in turning them into revenue.
- Return on Average Equity
- Calculation: We take trailing 12 months net profit and divide it by average equity (average of latest quarter and corresponding quarter the year before).
- Rationale: We wanted to measure how effective companies are at deploying shareholder capital.
- Return on Average Assets
- Calculation: We take trailing 12 months net profit and divide it by average assets (average of latest quarter and corresponding quarter the year before).
- Rationale: We wanted to measure how well companies can use their assets to generate profit.
Category 4: Risk (Leverage & Liquidity)
- Net Debt/Equity
- Calculation: We look at debt as of the latest quarter, subtract cash and cash equivalents as of the latest quarter then divide it by equity as of the latest quarter.
- Rationale: We wanted to measure companies’ capital structure.
- Current Ratio
- Calculation: We divide companies’ current assets by current liabilities as of the latest quarter.
- Rationale: We wanted to assess companies’ liquidity position.
- Loan-to-Deposit Ratio (LDR) — Banks Only
- Calculation: We divide total loans by total deposits from the latest quarter.
- Rationale: To assess the bank’s liquidity in terms of its credit/lending capacity.
Category 5: Earnings Quality
- Operating Profit/Net Profit
- Calculation: We sum the trailing 12-month operating profits then divide it by the trailing 12-month net profits.
- Rationale: We wanted to assess companies’ quality of earnings by making sure a significant portion of them came from operating profits.
- Cash Flow from Operations/Total Liabilities – Banks Only
- Calculation: We sum the trailing 12-month cash flows from operations then divide it by average total liabilities (average of the latest quarter and the corresponding quarter the year before).
- Rationale: We wanted to replace the net debt-to-equity ratio used for non-financial companies with another metric that can gauge banks’ financial health.
Valuation
The methodology described above aims to identify fundamentally-strong EGX-listed companies, but it does not take into account a measure of whether or not the stock’s current price is overvalued or undervalued.
That’s why we added a valuation factor as the final screening step. The final list of companies are those with strong fundamentals & a last-twelve-month price-to-earnings (PE) multiple of 7x or less.
The rationale behind choosing a PE multiple of 7x or less comes from the inverse relationship between the cost of investing in Egyptian equities & PE: When the cost of equity is high, the P/E ratio tends to be lower, and vice versa. This is because a higher cost of equity implies a higher required return for investors, which usually results in a lower stock price if earnings remain constant. Consequently, the P/E ratio would be lower.
We believe that an appropriate long-term cost of investing in Egyptian equities is 15%; the inverse (PE) of 15% is 7.
How else can Rumble help me on my investing journey?
- Fundamental Analysis Recommendations: Find strong companies to buy and hold.
- Technical Analysis Recommendations: Identify the best entry and exit points.
- Exclusive Content: Access a library of content designed to make you a smarter investor.
- Community Access: Join an exclusive group of investors where you can share ideas and connect directly with experts.
Your first month on Rumble is free, so why not give it a try and see how we can help you become the smartest investor in the room?
Download Rumble – [App Store] [Play Store]


