We’re thrilled to introduce one of the most highly anticipated and requested features!
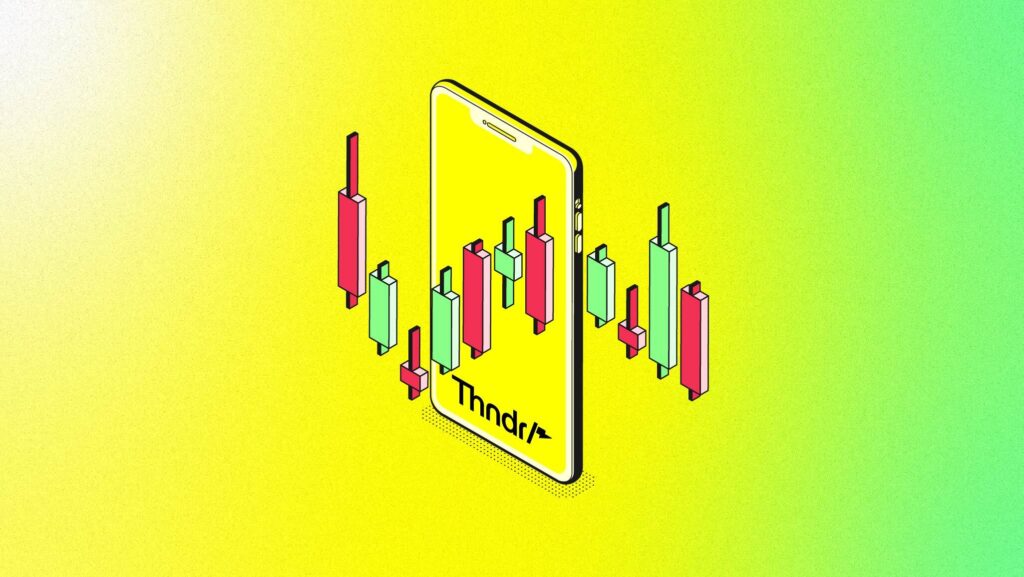
Starting today, “Spark” subscribers will have access to a toggle for switching between simple charts and candlestick charts on both the Thndr app and web version.
This feature will enhance your ability to analyze market data and trade like a technical analyst.
Whether you prefer the simplicity of line charts or the detailed insights of candlestick charts, you can now switch between them with ease.
How can I read candlestick charts?
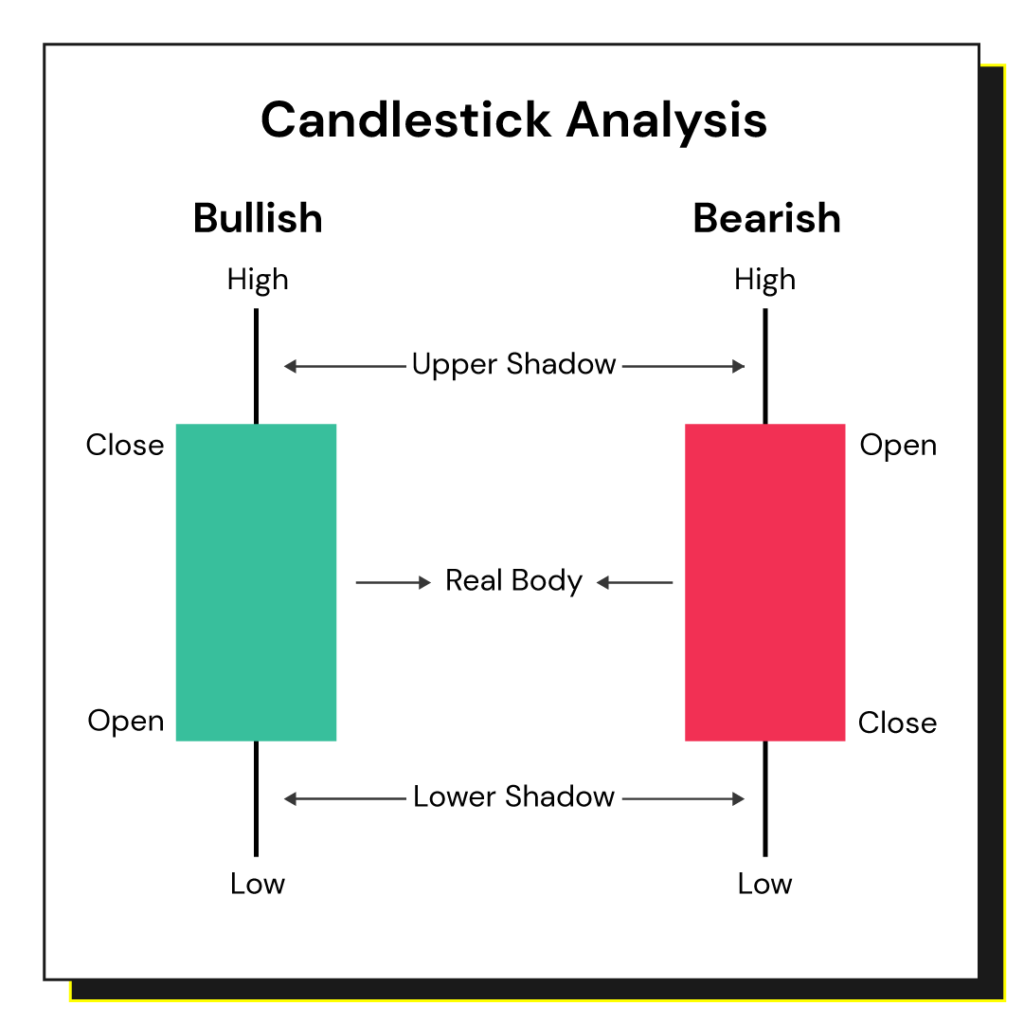
Why are candlestick charts useful?
Candlestick charts are essential in technical analysis, offering rich insights into how investors feel about a stock and price action. By recognizing various candlestick patterns and formations, investors can predict potential shifts in market trends or sentiment.
These patterns serve as visual indicators, conveying crucial information about the psychology between buyers and sellers.
Technical analysts can use them to identify possible reversals, continuations, or indecision in the market, aiding in decision-making processes like entering or exiting positions.
Understanding these patterns empowers you to make informed trading choices based on historical price movements and market behavior.
Let’s take a look at a few introductory patterns.
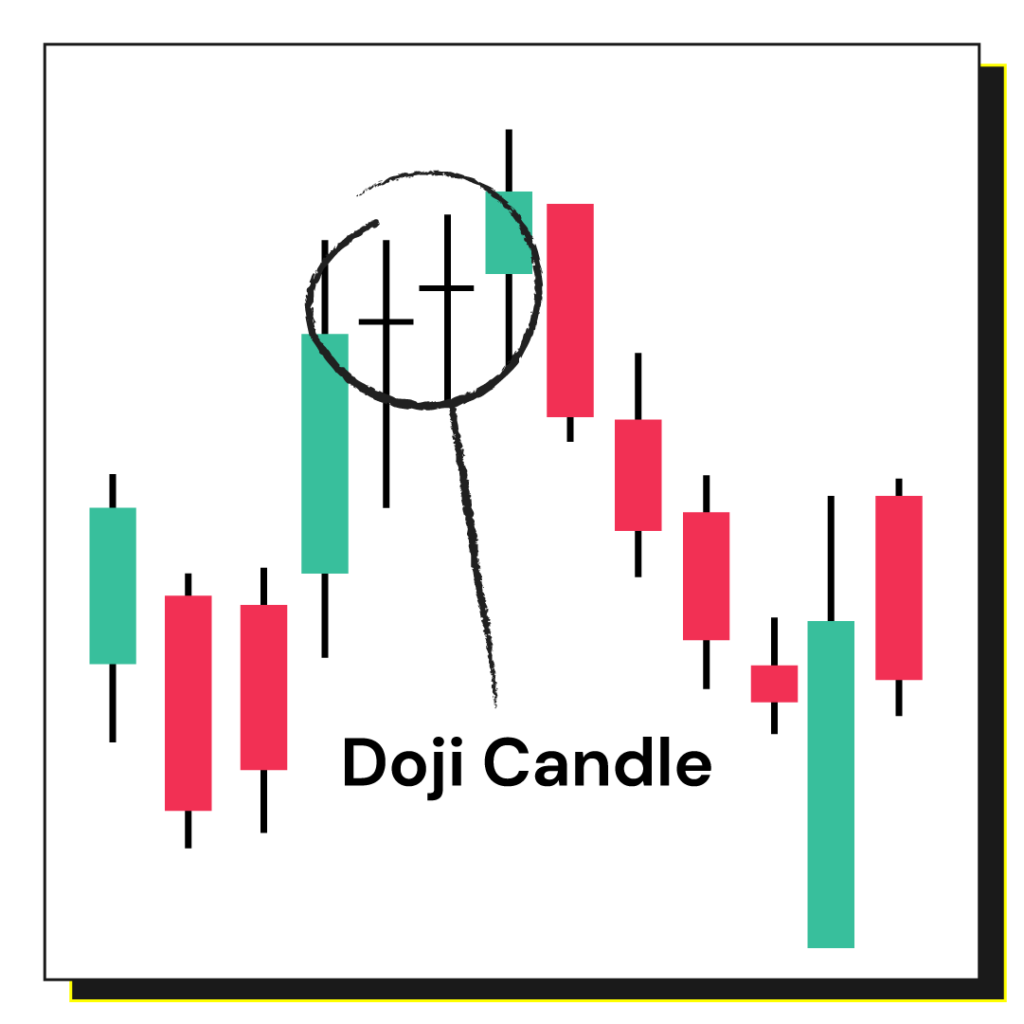
1. Doji – A Doji is a single candlestick pattern that indicates market indecision. It forms when the opening and closing prices are very close or nearly the same, resulting in a small or non-existent body with long upper and lower shadows. Doji patterns often signify potential reversals in the market.
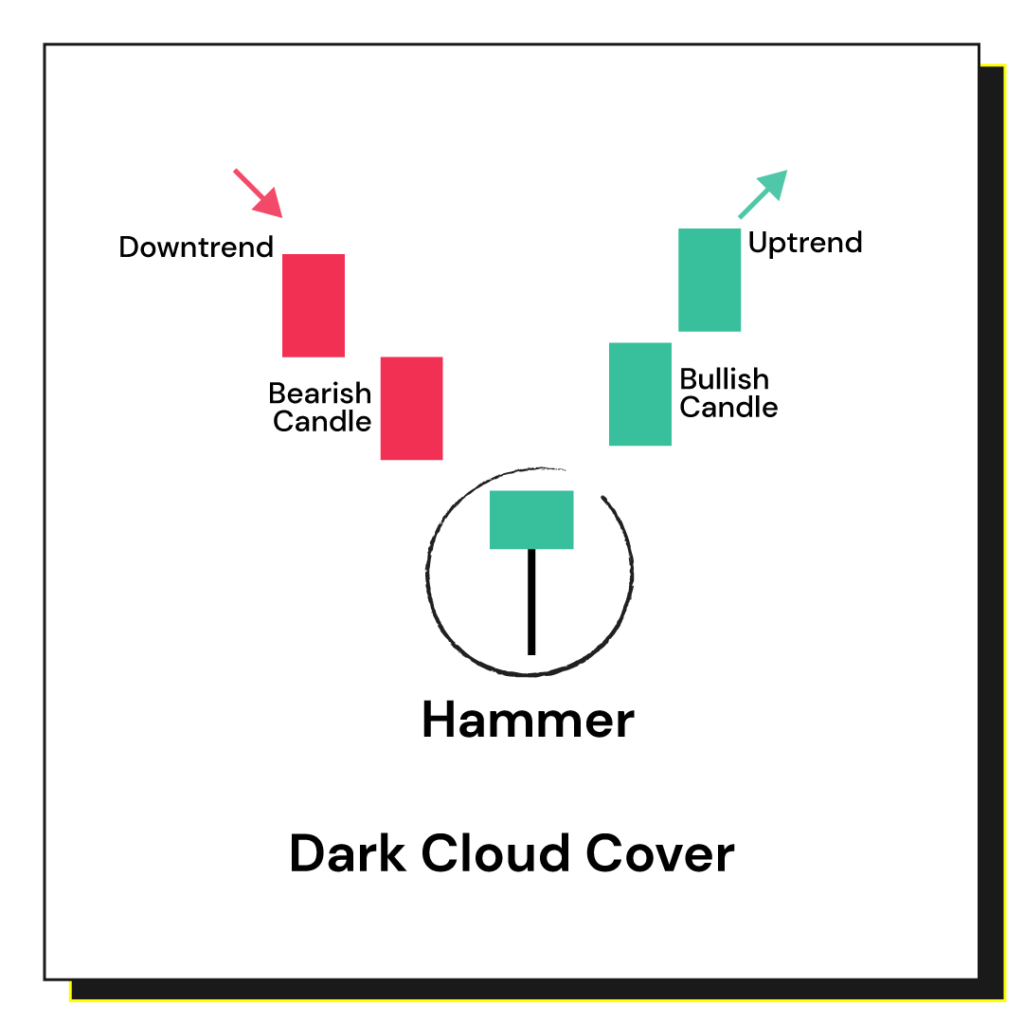
2. Hammer – The Hammer is a bullish reversal pattern that usually forms at the bottom of a downtrend. It consists of a small body near the top of the candlestick and a long lower shadow that is about two or three times the length of the body. This pattern indicates a potential trend reversal from bearish to bullish.
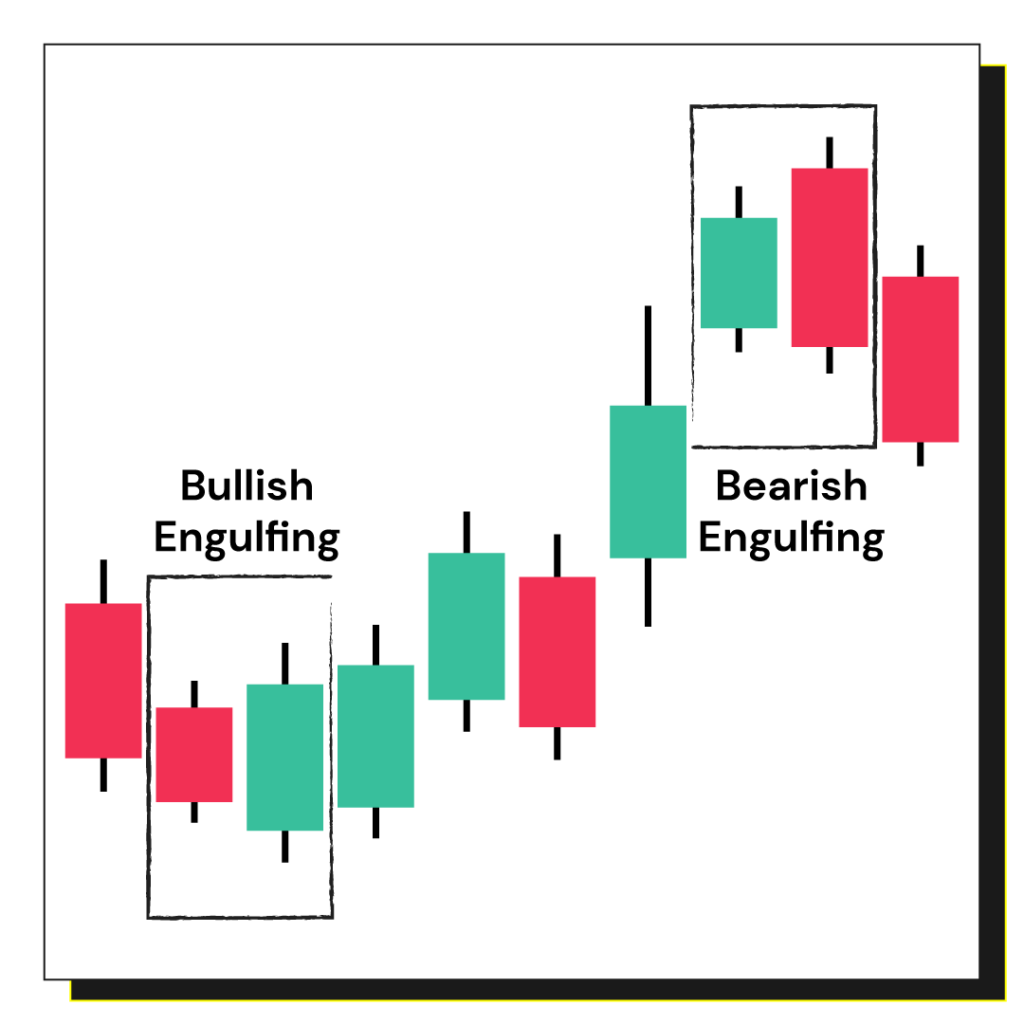
3. Engulfing Pattern – The Engulfing pattern consists of two candlesticks and indicates a potential reversal in the market. The bullish Engulfing pattern occurs during a downtrend when a smaller bearish candle is followed by a larger bullish candle that completely engulfs the body of the previous candle. The bearish Engulfing pattern is the opposite, signaling a potential reversal from an uptrend to a downtrend.
4. Morning Star – The Morning Star is a bullish reversal pattern that occurs at the bottom of a downtrend. It consists of three candles.
1) The first candle is a bearish (downward) candlestick, indicating a continuation of the existing downtrend.
2) The second candle is a smaller-bodied candlestick that typically opens lower than the previous candle’s close, creating a gap down. This candlestick’s small size signifies indecision or a potential slowing down of the selling pressure.
3) The third candle is a bullish (upward) candlestick that opens higher than the second candle’s close and ideally closes beyond the midpoint of the first candle’s body. This candle indicates a potential reversal of the downtrend.

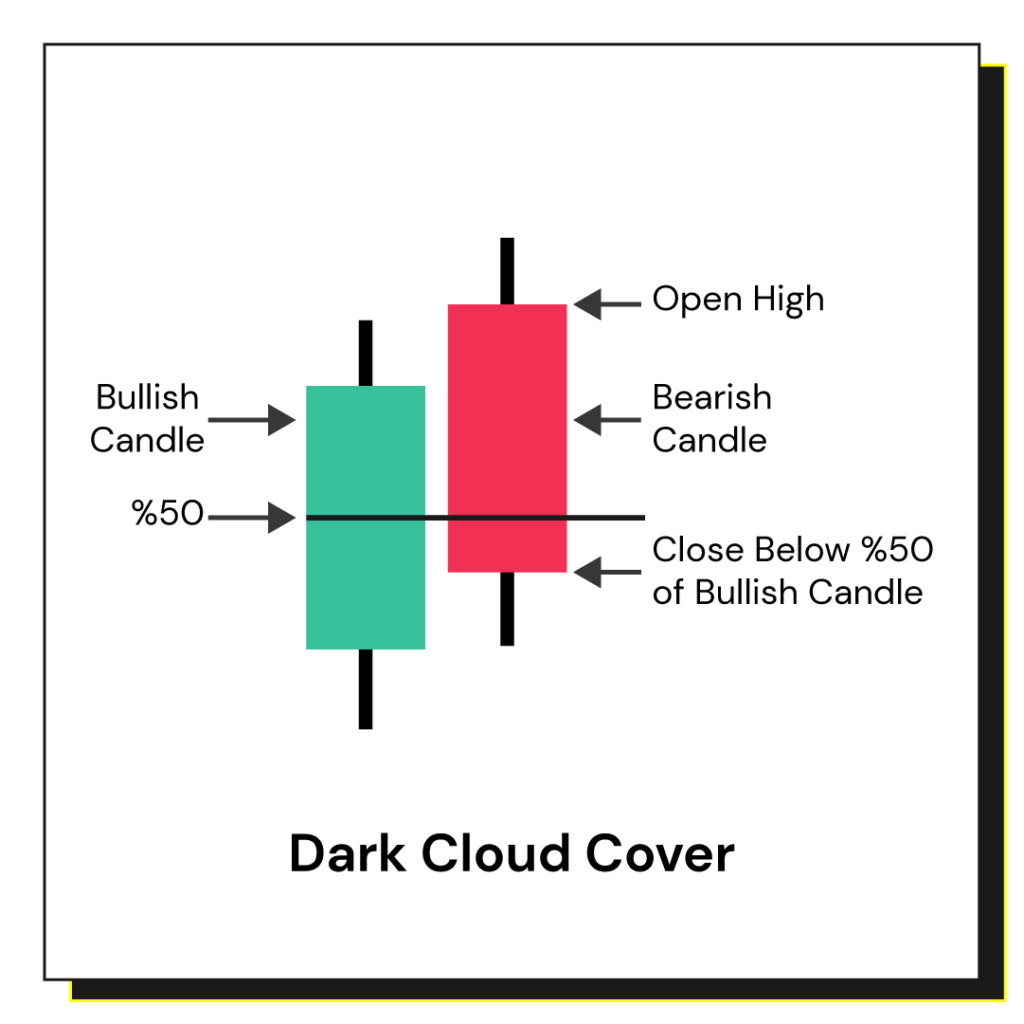
5. Dark Cloud Cover – The Dark Cloud Cover is a bearish reversal pattern that forms at the end of an uptrend. It comprises two candles. The first candle is a bullish candlestick, followed by a bearish candlestick that opens above the previous day’s high and closes below the midpoint of the first candle’s body. This pattern suggests a potential reversal from an uptrend to a downtrend.
Please note that while these patterns are widely recognized, it’s essential to consider them in the context of other technical indicators and factors influencing the market before making investing decisions. Learning to interpret candlestick patterns takes time and practice. Always combine them with other analysis tools for better accuracy and risk management.
We hope that the candlestick charts on Thndr help you on your investing journey.