
It’s true – Electric Stocks are going away, but that’s only because we’re replacing them with a new and improved theme: Solid Stocks!
The changes to our Electric Stocks methodology are to make the list more accurate, relevant for longer, and more objective.
This is all thanks to Rumble – our new investment recommendations platform. Rumble’s experts are licensed by the Financial Regulatory Authority to publish investment research and recommendations.
What are Solid Stocks?
Solid stocks are stocks of companies that have consistently been delivering strong above-market average financial results updated every quarter (3 months). Ideally, a solid company would have the following characteristics:
– A solid business model
– Above-average growth
– Ability to generate profits from invested capital
These characteristics all feed into the business growth in value and turn long-term returns.
To find these solid companies for you, we go back to their financial statements over the last eight quarters to look at specific ratios that imply a company has these solid and healthy characteristics.
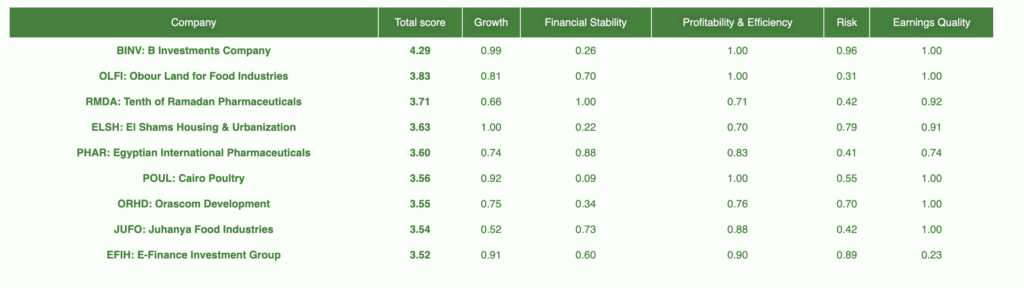
These ratios are grouped into five main categories:
1) Growth
2) Financial performance stability
3) Profitability & Efficiency
4) Risk
5) Earnings quality
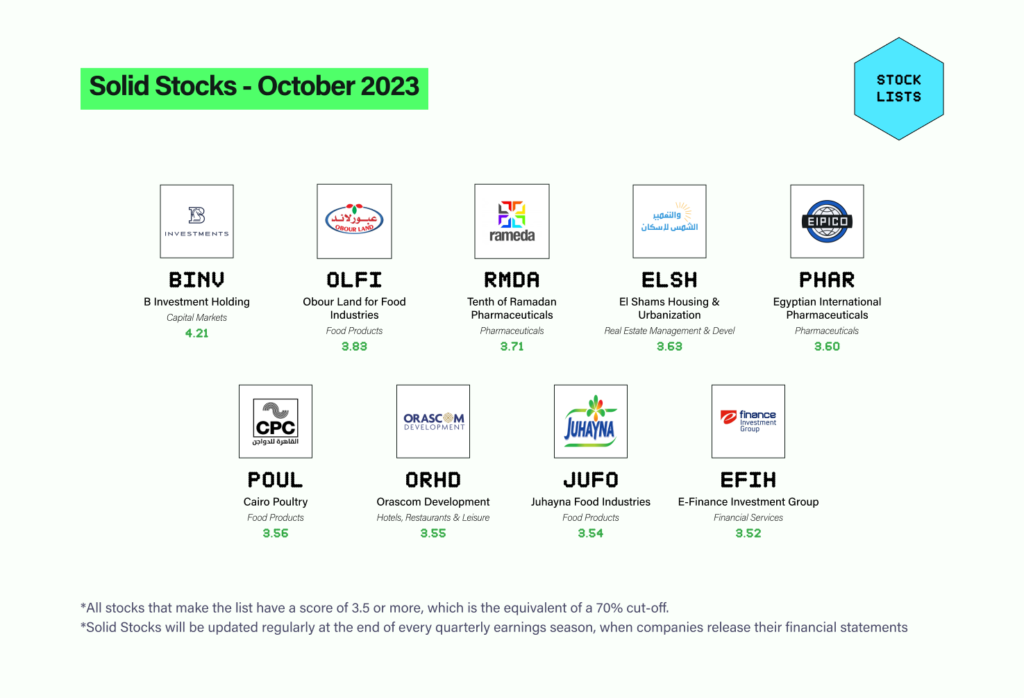
Here’s our very 1st list of Solid Stocks
A brief history
Electric Stocks was launched on Thndr back in May 2021 in an effort to provide guidance on which companies are solid from a fundamental standpoint. Today, with Rumble’s launch we want to revamp our methodology to provide a more accurate list of fundamentally solid companies.
Electric Stocks methodology refresher
Electric Stocks were built using a factor investing methodology to come up with a 3-component scoring mechanism that consists of the resulting score, a weight, and a binary. The scores of all ratios were then added to calculate an overall score that we used to rank stocks relative to one other.
– Score: A number between 0 and 5 and based on how well the company measures in a given ratio.
– Weight: An equal-weight percentage determined by dividing 100% by how many ratios there are.
– Binary: A flag that is 0 or 1 to exclude a ratio in the event of a null agent or other pre-specified conditions, such as false negatives.
You can check out an in-depth breakdown of the methodology here.
The upgrade to Solid Stocks
– We’re removing all valuation metrics. This is because valuation metrics change on a daily basis and make our score less timely and sometimes invalid. We’ve also introduced more fundamental factors instead to ensure that our scores better assess the overall health of the companies.
– We’re no longer assigning subjective high and low scores to the factors. Instead, we looked at all the companies in the market and took the highest and lowest available score for each factor, excluding outliers. We then scored the companies based on where they fall on the curve. This will make our scores more relevant to the market and less subjective.
– We’re simplifying the way we determine factor weights by having an equal-weight policy across the 5 different categories. This will make our scores more objective.
– Solid Stocks will be updated regularly at the end of every quarterly earnings season when companies release their financial statements.
The way our list of Solid Stocks is determined each quarter is by taking the companies with the highest scores and then filtering them by trading liquidity considering the mode of their stocks’ 6-month daily traded value. Only companies with a mode above EGP 0.5 million make the final cut. This is a safety measure to ensure that these companies’ stocks are relatively liquid.
Solid Stocks scoring methodology
Category 1: Growth
– 8-Quarter Revenue Compounded Quarterly Growth Rate (CQGR)
Calculation: We calculate the compounded growth rate (CGR) over the past eight quarters. For example, the latest financials are for Q2 2023, so we take the CGR from Q3 2021 to Q2 2023.
Rationale: We wanted to measure the growth of companies’ top lines.
– 8-Quarter Operating Profit Compounded Quarterly Growth Rate (CQGR)
Calculation: We calculate the compounded growth rate (CGR) over the past eight quarters. For example, the latest financials are for Q2 2023, so we take the CGR from Q3 2021 to Q2 2023.
Rationale: We wanted to measure the growth of companies’ operational performance.
Category 2: Financial Performance Stability
– 8-Quarter Revenue Coefficient of Variation (standard deviation/average)
Calculation: We divide the standard deviation of the past 8 quarters (i.e. Q3 2021 to Q2 2023) by their average.
Rationale: We wanted to make sure revenues aren’t volatile, such as those that depend on contracts or are cyclical by nature.
– Operating Profit Margin Coefficient of Variation (standard deviation/average)
Calculation: We divide the standard deviation of the past eight quarters (i.e. Q3 2021 to Q2 2023) by their average.
Rationale: We wanted to make sure companies with non-recurring items skewing operating profits are not given a misrepresentative high score.
Category 3: Profitability & Efficiency
– Asset Turnover Ratio
Calculation: We take trailing 12-month sales and then divide them by average assets (average of the latest quarter and corresponding quarter the year before).
Rationale: We wanted to measure how well companies utilize their assets in turning them into revenue.
– Return on Average Equity
Calculation: We take the trailing 12 months’ net profit and divide it by the average equity (the average of the latest quarter and the corresponding quarter the year before).
Rationale: We wanted to measure how effective companies are at deploying shareholder capital.
– Return on Average Assets
Calculation: We take the trailing 12 months’ net profit and divide it by average assets (average of the latest quarter and the corresponding quarter of the year before).
Rationale: We wanted to measure how well companies can use their assets to generate profit.
Category 4: Risk (Leverage & Liquidity)
– Net Debt/Equity
Calculation: We look at debt as of the latest quarter, subtract cash and cash equivalents as of the latest quarter then divide it by equity as of the latest quarter.
Rationale: We wanted to measure companies’ capital structure.
– Current Ratio
Calculation: We divide companies’ current assets by current liabilities as of the latest quarter.
Rationale: We wanted to assess companies’ liquidity position.
– Loan-to-Deposit Ratio (LDR) — Banks Only
Calculation: We divide total loans by total deposits from the latest quarter.
Rationale: To assess the bank’s liquidity in terms of its credit/lending capacity.
Category 5: Earnings Quality
– Operating Profit/Net Profit
Calculation: We sum the trailing 12-month operating profits and then divide it by the trailing 12-month net profits.
Rationale: We wanted to assess companies’ quality of earnings by making sure a significant portion of them came from operating profits.
– Cash Flow from Operations/Total Liabilities – Banks Only
Calculation: We sum the trailing 12-month cash flows from operations then divide it by average total liabilities (average of the latest quarter and the corresponding quarter the year before).
Rationale: We wanted to replace the net debt-to-equity ratio used for non-financial companies with another metric that can gauge banks’ financial health.
You’ll find the descriptions for each company here.
Limitations
The methodology described above aims to identify fundamentally-solid companies that are listed on the EGX. It does not aim to outperform any benchmark nor does it take into account any valuation metrics – meaning that we can vouch for a company’s fundamentals, but not necessarily for its current market valuation.
Business Models
B Investments Holding [BINV]
Established in 2005, BINV is an Egypt-based private equity firm with exposure to real estate, non-banking financial services, renewable energy, consumer, and health care. Its subsidiaries include Madinet Masr Housing & Development [MASR], Ebtikar, Basata for E-Payments, Infinity Solar, and Gourmet.
Obour Land for Food Industries [OLFI]
Established in 1997, OLFI is a leading white cheese manufacturer in Egypt, specializing in the production, processing, and packaging of different types of cheese as well as milk and juice, capitalizing on its distribution platform that covers all of Egypt.
Rameda [RMDA]
RMDA is an Egypt-based pharmaceutical company that manufactures both human and veterinary pharmaceuticals through its three-factory plant with 20 production lines producing a wide range of general medicinal forms.
El-Shams Housing & Development [ELSH]
Established in 1946, ELSH offers affordable housing with reasonable payment terms. It has seven landmark projects and two active developments (Gardenia in the Sixth of October City and Solana in the New Administrative Capital).
EIPICO [PHAR]
Established in 1980, PHAR produces different types of drugs, such as anesthetics, antibiotics, dermatological drugs, and vitamins among others. PHAR exports its products to different countries in the EMEA region. It is currently building its third factory to produce biosimilars, the first of its kind in the Arab markets.
Cairo Poultry [POUL]
POUL is an Egypt-based company that operates in the farming and food processing sectors. The company focuses on the production, breeding, and fattening of chicks, the production of animal feed, and the hatching of eggs, as well as participating in similar projects inside and outside Egypt.
Orascom Development Egypt [ORHD]
ORHD is an Egypt-based company engaged in the real estate and hospitality sectors. The company is an integrated developer of resort towns in Egypt, with a business model involving the development of residential units, hotels, and recreational facilities.
Juhayna Food Industries [JUFO]
Founded in 1983, JUFO operates in the food processing industry, structured into five business segments: Milk, Chilled Products, Juices, Concentrates, and Agriculture.
E-Finance [EFIH]
Established in 2005, EFIH has been at the forefront of Egypt’s digital economy as the sole and exclusive provider of financial services to the Egyptian government. EFIH’s established infrastructure allows it to be the leading provider of digital services and e-payment solutions to government, businesses, and citizens.