Every month, Thndr Trader subscribers who traded actively get a short PDF that looks at how they traded, not just what they made. This is the full story of why we built it, who receives it, what every number means and exactly how it is calculated.
Reading time: about 15 minutes. If you only want the definitions, jump to the appendix at the end.
Why we are doing this
Most trading apps are very good at telling you one number: how much you are up or down. That number matters, but on its own it is a poor teacher. A month can end in profit because of one lucky trade while every habit underneath it was costing you money, and a month can end in a small loss while you were actually doing most things right.
Professional traders know this, which is why they review themselves on habits rather than on outcomes: how often they win, how big their wins are compared with their losses, whether they cut losers quickly or sit on them, whether they bet bigger on the trades that turned out badly. Those habits are what you control. The outcome in any one month is mostly noise around them.
The Monthly Trading Review brings that kind of self-review to every active trader on Thndr. Think of it as a fitness tracker for your trading: it measures what you did, puts it next to people who trade the way you do, and tells you plainly what is working and what is not. It is built entirely from your own order history, it uses fixed rules that are the same for everyone, and it never tells you what to buy or sell.
Nothing in the review is advice. It is your own trading, measured.
Who receives it
The review is part of the Thndr Trader subscription. You will receive one for a given month if you were a Trader subscriber during that month and you closed at least five trades of the same style in EGX-listed stocks in that month: five or more scalps, five or more day trades, or five or more swings. Five scattered trades across styles do not earn a card, because no single style has enough trades to judge. “Closed” is the important word: a trade only counts once you have sold out of the position completely (more on that below). Positions you are still holding are not judged.
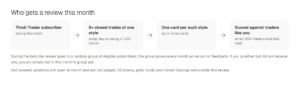
The review is in beta. During the beta we send it to a random group of eligible subscribers and increase the size of that group every month as we act on feedback. So if you qualified and did not receive one, nothing is wrong with your account; you are simply not in this month’s group yet. The email goes out in the first days of the following month, once the exchange has published its final closing prices and the month’s dividends have settled.
The review covers your EGX stock trading only.
What arrives in your inbox
A PDF of two to five pages, depending on how many trading styles you used. It always has three parts:
- Your month in three lines. What drove your result, the one pattern worth reviewing, and what changed since last month.
- One card per trading style. Scalps, day trades and swings each get their own card when you closed at least five of them. Each card rates four habits and ends with three short boxes: your trading profile, one pattern to review, and what is working.
- The method page. A one-paragraph version of this post, so the rules are always next to the numbers.
The three figures below are taken from a real September review (name removed), with each part of the page explained.
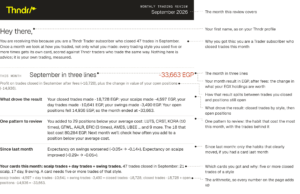
Figure 2a · Page one: the month at a glance.
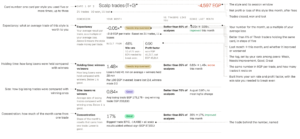
Figure 2b · One card: the header and the four rated habits.
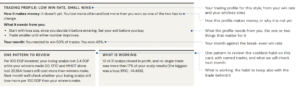
Figure 2c · The same card: the three plain-language boxes.
The one idea everything rests on: what is a trade?
Before any habit can be measured we need to agree on what one trade is. In the review, a trade is one whole round trip in one stock. It opens the moment you first hold the stock and it closes only when you sell your way back to zero shares. Everything in between belongs to that same trade: adding to the position, selling part of it, adding again.
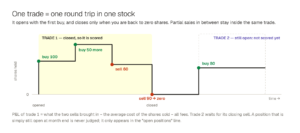
Figure 3 · A trade opens at the first buy and closes at the sell that takes you to zero.
This has a few consequences that are worth knowing:
- A position you keep adding to and trimming for months is still one trade, however many orders it took. It is scored when you finally close it.
- A trade is only evaluated if it was closed by a sell. If a position is transferred out to another broker, it simply disappears without a result.
- Your cost is a moving average. Each buy, including its commission, is added to the cost of the shares you hold; each sell takes out the average cost of the shares sold. So “profit” on a trade means proceeds minus the average cost of what you sold minus all fees on both sides. Fees are counted exactly once.
- Corporate actions such as stock dividends, splits and rights issues change the share count without changing what you paid, and they never open or close a trade on their own.
Your trading style
People trade very differently, and a scalper should not be measured with a swing trader’s ruler. So each trade is first labelled by how long it lasted, counted in EGX sessions (days the exchange was open), from the day it opened to the day it closed.
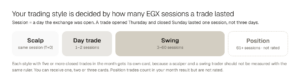
Figure 4 · Four styles, three of them rated.
A trade opened and closed in the same session is a scalp. Closed one or two sessions later it is a day trade. Three to sixty sessions is a swing. Anything held longer than sixty sessions is a position trade: it counts in your month result, but it is not rated, because a position held for months tells us little about your trading habits.
Every style in which you closed five or more trades in the month gets its own card. One person may receive a scalp card and a swing card in the same month, and no day-trade card, because they only closed three day trades. Five is the minimum below which a number is more luck than habit.
The four habits on every card
Each card rates four things. For each one you see your own number, how it compares with Thndr traders holding the same card this month, and how it compares with your own number last month. Here is what each measures and why it matters.
1. Expectancy: what one average trade is worth to you
Take everything your style made or lost this month, after fees, and divide by the number of trades. That is your expectancy in EGP: what you can expect an average trade to be worth. Above zero, the style made money; below zero, it lost money.
To make it comparable between someone who trades with EGP 5,000 and someone who trades with EGP 500,000, the card shows expectancy as a multiple of your average losing trade. “0.36×” means an average trade is worth 36% of a typical loss. The sign is what matters most; the size tells you how comfortable the margin is.
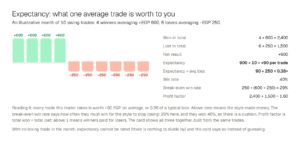
Figure 5 · Expectancy, win rate, break-even win rate and profit factor from one illustrative month.
Underneath expectancy the card shows the two numbers it is built from:
- Win rate is simply how many of your trades closed in profit. Next to it is your break-even win rate: given the size of your average win and average loss, how often you need to win for the style to stop losing. If your win rate is above the break-even rate you have a cushion; if it is below, your wins are too small for how often you lose.
- Profit factor is everything you won divided by everything you lost. Above 1, winners paid for losers; below 1, they did not.
If you had no losing trade in the month, expectancy cannot be rated, because there is no loss to measure your wins against. The card says so rather than pretending, and shows your expectancy in EGP and your win rate instead.
2. Holding time: winners versus losers
One of the oldest observations about traders is that they let losers run and cut winners short. This habit puts a number on it: the average time you held your losing trades divided by the average time you held your winning trades. A ratio above 1 means you sat on losers longer than on winners. Lower is better.
Holding time is clock time from the first buy to the final sell, shown in minutes, hours or days as appropriate. Underneath, the card also shows what your losers cost and your winners made per 100 EGP invested, which is the same habit seen through money rather than time.
3. Size: losers versus winners
The average size of your losing trades divided by the average size of your winning trades. Size is the most money you had in the position at any point during the trade. A ratio above 1 means your losing trades were your bigger bets, which is the single most common way a decent win rate still ends in a losing month. Lower is better.
4. Concentration
How much of the month came from one trade. We add up every trade’s result without its sign, then ask what share of that total the single biggest trade accounts for. 13% means your month was spread across many trades; 60% means one trade decided it, for better or worse. Lower is better, because a month that depends on one trade is a month that could easily have gone the other way.
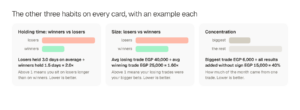
Figure 6 · Holding time, size and concentration, with an example each.
“Better than 60% of day traders”: how the comparison works
Your number on its own is hard to judge. Is a holding ratio of 1.3× normal? Is 40% concentration high? So each rated habit is ranked against every Thndr trader who holds the same card in the same month: scalpers against scalpers, swing traders against swing traders. “Better than 60%” means your number beat 60% of them.
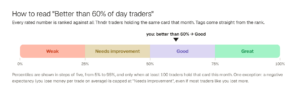
Figure 7 · Reading a percentile and the tag that comes from it.
The tag next to each number comes straight from that rank: Weak if you beat fewer than 25% of your peers, Needs improvement up to 50%, Good up to 75%, and Great from 75% up. Percentiles are shown in steps of five, from 5% to 95%.
There is one deliberate exception. A negative expectancy means the style lost money per trade, and we will not call that Good or Great just because most of your peers lost more. A negative expectancy is capped at Needs improvement whatever its rank.
Win rate gets a rank too, but no tag, because a low win rate with big wins is a perfectly good way to trade and a high win rate with small wins is a dangerous one. The tag belongs to expectancy, which combines the two.
Since last month
The right-hand column of each card compares your number with your own number for the same style last month. It only speaks when the change is meaningful: a move of at least 15%, or a smaller move that crossed from one tag band into another. Otherwise it says “no meaningful change”. If you did not trade that style last month, or had too few trades for a card, it tells you that instead, so a comparison against three trades is never dressed up as a trend.
The three boxes at the bottom of each card
Your trading profile
Two facts, your win rate and whether your average win is bigger than your average loss, place you in one of five profiles. Each profile has its own short description of how it makes money and what it needs from you to keep working. They are fixed texts; your numbers are filled in.
|
Profile |
What it means |
| High win rate, big wins | You are right more often than wrong, and your wins pay more than your losses cost. Both numbers work for you. The risk is sizing up after a winning run. |
| High win rate, small wins | Many small wins pay for fewer, larger losses. It works only while your win rate stays above your break-even rate, so loss size is the thing to watch. |
| Low win rate, big wins | You lose as often as you win, or more, but your winners pay for the losses. This is how trend-following works; it needs patience with winners and strict limits on losers. |
| Low win rate, small wins | It does not make money yet. You lost more often and lost more than you won, so one of the two has to change, starting with loss size. |
| High win rate, no losses yet | Every trade closed in profit this month. There is no loss to measure against, so judge it over several months. |
One pattern to review
This box looks for one specific, costly habit in your month and names it with the stocks involved. Nothing is written freehand; each pattern has a fixed test and appears only when the test is met. The card box checks two patterns within that style:
- One trade made most of the losses. At least three losing trades, and the biggest one was half or more of everything the style lost.
- Losers cost more than winners make, per 100 EGP. At least three winners and three losers, and your losing trades lost more per 100 EGP invested than your winning trades made.
The three-lines summary on page one adds three account-wide patterns that cut across styles:
- Adding to a position below your average cost (averaging down), on at least two trades.
- A bigger trade right after a loss: the next trade you opened after a losing one was more than 1.25 times your usual size, at least twice.
- Buying the same stock again within five sessions of losing on it, at least twice.
When several patterns qualify, the one that cost the most EGP is shown. When none qualifies, the box says so and tells you what we will check next month. Either way it ends with the follow-up we will run on your next review, so you can see whether the habit changed.
What is working
The habit on which you ranked highest, if you beat at least half of your peers on it, in a sentence built from your own numbers. We think a review that only lists faults is one you stop reading, and most months have at least one thing to keep doing.
Your month result, and why open positions are listed but not judged
The number at the top of page one is your result for the month in EGP. It is the change in what your EGX holdings were worth between the last session before the month and the last session of the month, corrected for the cash you put in or took out through buying and selling, after all commission, plus cash dividends received, and allowing for any shares you transferred in or out.
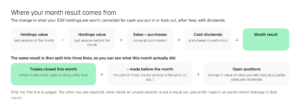
Figure 8 · The month result and its three lines.
The same number is then split into three lines. “Trades closed this month” is the profit or loss of every trade you closed during the month, after fees, measured from each trade’s own cost over its whole life. “Made before the month” takes back out the part of those results that was already in the price when the month started, so that profit stays with the month that earned it. “Open positions” is the change in value of positions you still hold at month end, including any partial sales you made from them during the month and cash dividends. The three always add up to the month result, to the pound.
The second line is the one that surprises people, so here it is plainly. Say you bought a stock in January and sold it in September for a gain of EGP 50,000, of which 45,000 was already there on 31 August. Your September review shows trades closed this month +50,000, because that is what the trade made over its life, and made before the month −45,000, because the month itself only added 5,000. Your open positions line is untouched by it. It is the price of scoring a trade from its true cost rather than from an arbitrary month-start value, and the line only appears when an older position closes.
“Closed trades” is also wider than the cards. A style with fewer than five trades in the month, and position trades held longer than sixty sessions, are closed trades too, so they sit in the closed-trades total even though no card rates them. The three-lines summary
spells this out as “other closed trades” with what is in it, so the cards’ P&L plus other closed trades always equals the closed-trades total.
Neither of the last two lines is ever rated. An unsold position is not a result yet, and profit made in an earlier month belongs to that month; we would rather tell you how your finished trades went than guess at the ones still running.
What the review deliberately does not do
- It does not give advice. It never says buy, sell, hold, or which stock to look at. The profile texts describe how a style makes money; they do not tell you what to trade.
- It does not: 1) judge open positions, 2) position trades held longer than sixty sessions, or 3) any month with fewer than five closed trades in a style.
- It does not use the same ruler for different styles. Your scalps are compared with other people’s scalps and nothing else.
- It does not write free text. Every sentence is a fixed template with your numbers filled in, and the same month’s data will always produce the same sentence.
Beta, and what we would like from you
The review is new and it will keep changing. We are rolling it out gradually to a random group of eligible subscribers, growing the group every month, and the rules and wording will evolve as we learn what is useful and what is confusing. What you tell us about it is the main thing deciding what the next version looks like.
Appendix: definitions and formulas
For readers who want the exact rules. Everything here is computed from the EGX order ledger behind your Thndr account; nothing is estimated.
Trades
| Term | Definition |
| Month | From the 1st at 00:00 to the next 1st at 00:00, Cairo time. |
| Event stream | All your fills and share movements in one stock, in time order. Share movements are classified from their description: transfer in / out, subscribed shares, corporate-action add / remove, restatement, fractional adjustment. |
| Position | Running sum of shares held. A trade starts at any addition (buy, transfer in, subscribed shares, corporate-action add) made when the position was at or below zero, and closes at the event that brings it back to zero or below. No dust rule: one share left is still an open trade. |
| Evaluated trade | A trade whose closing event is a sell fill. A position emptied by a transfer out is not evaluated. |
| Cost held | Moving average. Buy: cost + fill value + fill fee. Transfer in / subscribed shares: cost + quantity × entry price. Corporate-action adds, restatements and fractional adjustments leave cost unchanged (they add quantity at zero cost). Sell or transfer out: cost × (position after ÷ position before). Average cost = cost held ÷ position. |
| Fee per fill | The invoice’s commission split across its fills in proportion to fill value. Waived commission is not a fee. Buy fees go into cost; sell fees come off proceeds; each fee counts once. |
| Trade P&L | Sum over the trade’s sells of: fill value − shares sold × average cost before the sell − the fill’s fee. Winner if > 0, loser if < 0; exactly 0 is neither. |
| Holding time | Close time − open time (clock time). |
| T+ and style | Session number of the close date − session number of the open date (a non-trading date takes the previous session). T+0 scalp; T+1 to T+2 day; T+3 to T+60 swing; T+61 and above position (not rated). |
| Size | The maximum cost held at any point during the trade. |
Cards
| Term | Definition |
| Eligible | A Trader subscriber during the month with at least one card: a style (scalp, day or swing) with five or more evaluated trades closed in the month. |
| Card | One per style with n ≥ 5 trades closed in the month. n = trades; winners = P&L > 0; losers = P&L < 0. |
| Style P&L | Sum of trade P&L over the card’s trades, after fees. |
| Expectancy (EGP) | Style P&L ÷ n. |
| Expectancy vs average loss | Expectancy ÷ average |loser P&L|. Undefined with no loser. |
| Win rate | Winners ÷ n. |
| Break-even win rate | Average loss ÷ (average win + average loss). |
| Profit factor | Sum of winners’ P&L ÷ sum of |losers’ P&L|. |
| Holding ratio | Mean holding time of losers ÷ mean holding time of winners. Needs at least one winner and one loser. |
| Per 100 EGP | Losers: total lost ÷ total size of losers × 100. Winners: total won ÷ total size of winners × 100. |
| Size ratio | Mean size of losers ÷ mean size of winners. Needs at least one winner and one loser. |
| Concentration | |P&L of the biggest trade| ÷ sum of |P&L| over all the card’s trades, as a percentage. Biggest = largest absolute P&L. |
Ranks, tags and comparisons
| Term | Definition |
| Percentile | Among all cards of the same style in the month where the measure is defined (N cards): rank from worst to best (ties share the lower rank), r = rank − 1, percentile = r ÷ (N − 1) × 100, rounded to the nearest 5 and kept within 5–95. Higher is better for expectancy and win rate; lower is better for holding, size and concentration. Not scored if N < 100. |
| Tag | Weak < 25; Needs improvement < 50; Good < 75; Great ≥ 75. Negative expectancy is capped at Needs improvement. Win rate gets a percentile but no tag. |
| Since last month | Same user, same style, previous month. Shown as improved / worse when the relative change is ≥ 15%, or ≥ 5% and the tag band changed; otherwise “no meaningful change”. If last month had no card in that style the number of trades is stated instead. |
| Trading profile | High win rate = win rate > 50%. Big wins = average win > average loss. No losers = “High win rate, no losses yet”. |
| Card insight: one trade | Losers ≥ 3 and biggest loss ≥ 50% of total lost. |
| Card insight: per 100 EGP | Winners ≥ 3, losers ≥ 3, and per-100 loss of losers > per-100 gain of winners. |
| Pattern: below average cost | A buy (not a transfer) on an open trade at a price below the average cost at that moment, in a trade closed this month in a carded style; qualifies at two or more trades. |
| Pattern: bigger after a loss | Usual size = median size of the month’s closed trades. Instance = the first trade opened after a losing close whose size > 1.25 × usual size, in a carded style; qualifies at two or more. |
| Pattern: same stock again | A trade in a carded style opened within five sessions of a losing close on the same stock; qualifies at two or more. |
| Ranking of insights | Among the qualifying insights, the one with the most EGP lost is shown. |
| What is working | The rated habit with the highest percentile, if ≥ 50. |
Month result
| Term | Definition |
| Change in market value | Value of EGX holdings at the month’s last close − value at the last close before the month (quantity × closing price). |
| Net cash from trading | Over the month’s fills: + sell value − sell fee for sells; − buy value − buy fee for buys. |
| Dividends | Cash dividends paid during the month. |
| Shares moved in and out | Transfers in valued at the previous session’s close; subscribed shares at the subscription price; transfers out at the month-start close if held at month start, else at entry price. Corporate actions at zero. |
| Month result | Change in market value + net cash from trading + dividends − net value of shares moved in. |
| Closed trades | Sum of trade P&L over every evaluated trade closed in the month, all styles including position trades. |
| Other closed trades | Closed trades − the cards’ P&L: trades in a style with fewer than five closed trades this month, and position trades (held over sixty sessions). |
| Made before the month | For trades closed this month that were already held at month start: their value at the previous month-end close minus their average cost then. Shown as a deduction so the month only counts what happened in it. Blank when no such trade closed. |
| Open positions | Month result − closed trades + made before the month: the change in value of still-open positions, partial sales of them during the month, and cash dividends. |